Using Ingest Labs Debugging Session
Live Debugging is performed either in Staging environment or in the Production environment.
To perform Live Debugging on Ingest Labs:
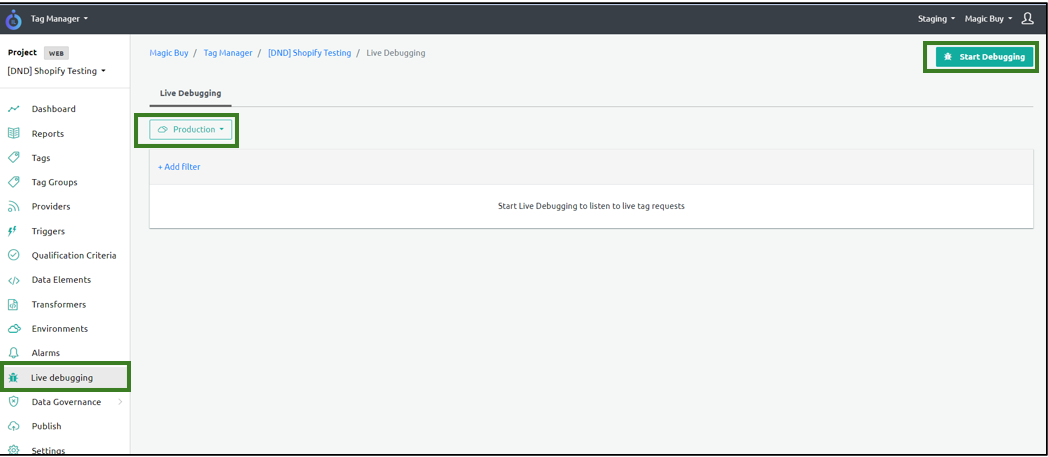
Select Live Debugging on the left navigation panel.
Select either Staging or Production under the Live Debugging section.
Click Start Debugging on the top right corner of the screen.
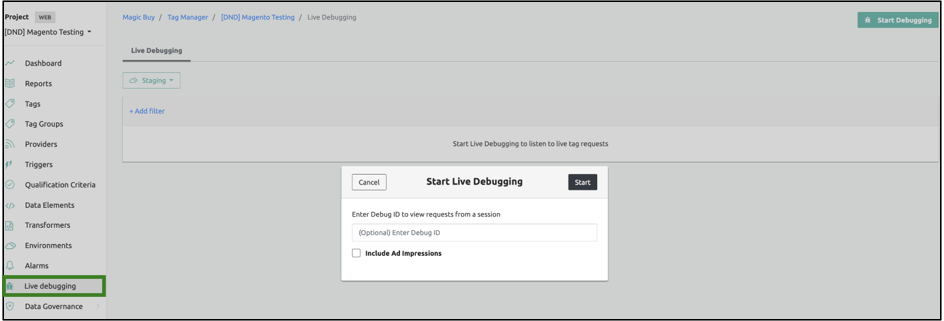
- Enter the Debug ID in the Debug ID field or click Start to start the debugging session. You need to enter a Debug ID to see events exclusively from your session on the website.
The following screen appears:
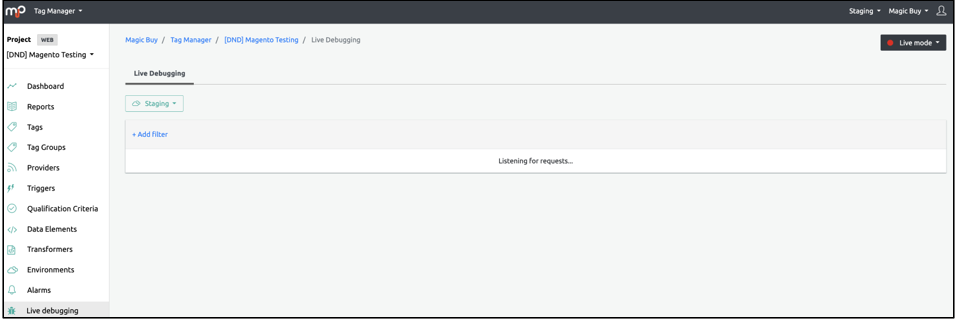
You can see all the tags configured in the tag session for the View Item list.
Note: The Debug ID is unique and is meant to streamline traffic tracking. Without a debug ID, you will be bombarded with general traffic data. Using a debug ID will help to streamline data and view the traffic for a particular session. A debug ID is not mandatory for Staging. A Debug ID is required for Production due to the huge network traffic.
- To retrieve the Debug ID, follow the procedure "Retrieve the DebugID Using Console".
Step Result: The live debugging details appear on the screen.