Live Debugging
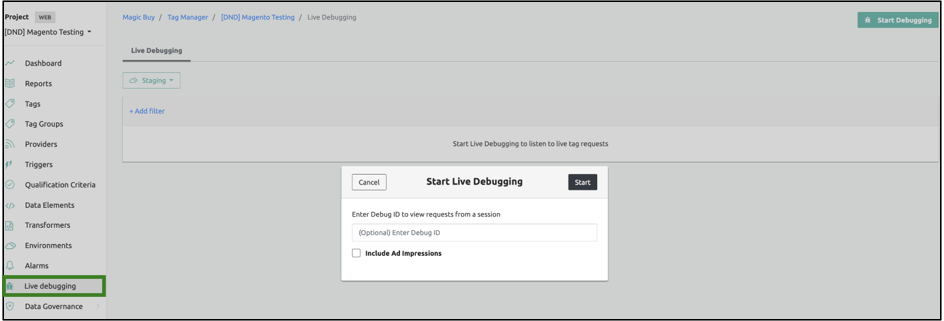
The Live Debugging feature in Ingest Labs displays all the tags that are trigerred in real-time on a particular page. You can perform live debugging for both the server-side tags and browser-side tags. The event data is populated in the live debugging section.
- Click on the start debugging button. Without entering the debug ID, you can view all the events firing in real-time traffic on the website.
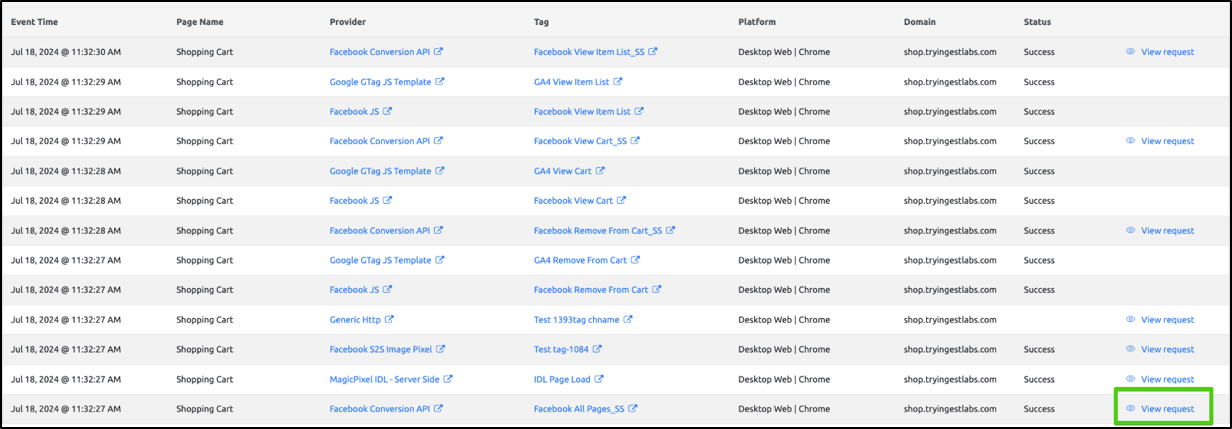
- Click on “View request” of any SS tag to view API call request/response body.
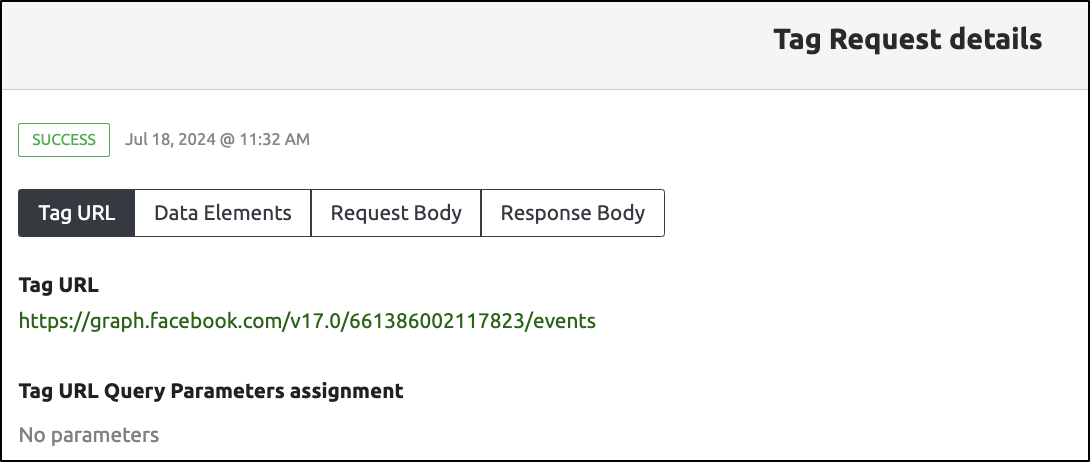
You can view the following tag details:
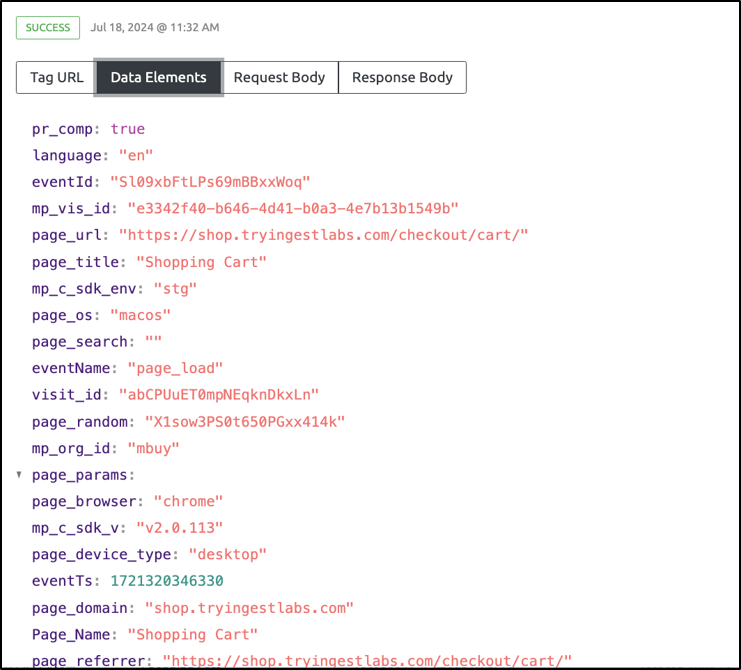
- Click "data elements" to view the data element details.
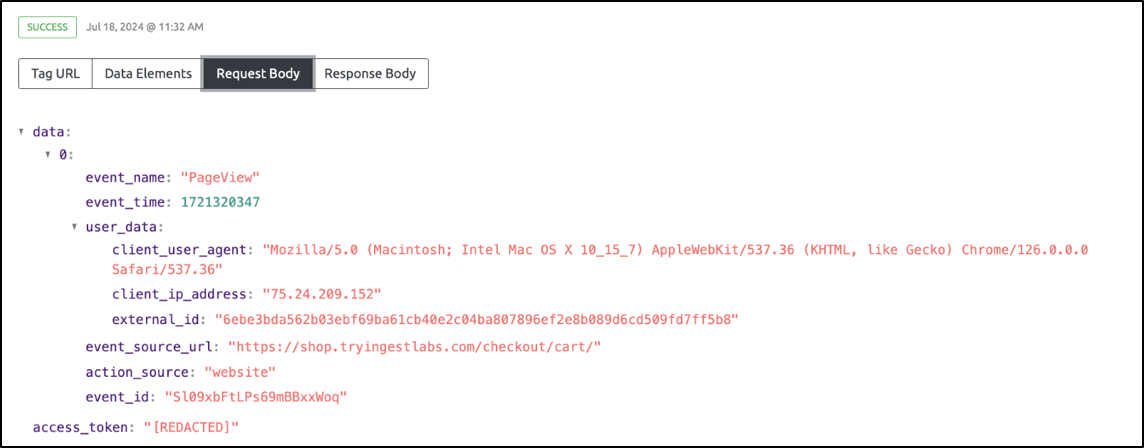
- Click "request body" to view the following page:
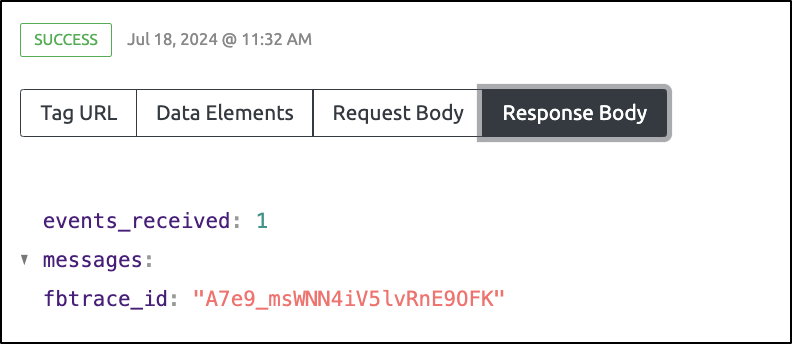
- Click "response body" to view the following page:
For all the tags that are triggered, you can view the following key information:
| Field Name | Description |
|---|---|
| Event Time | The event time-stamp. |
| Page Name | The page from which the tag is triggered. |
| Provider | Displays the Provider details. |
| Tag | Displays the Tag details. |
| Platform | Displays the Platform from which the page is accessed. |
| Status | Displays the tag status, whether the tag is successfully triggered or not. |
You can perform the Live Debugging in two ways, either through the console or through a Live Debugging session on Ingest Labs.
Related Topics
The Live Debugging section includes the following topics: