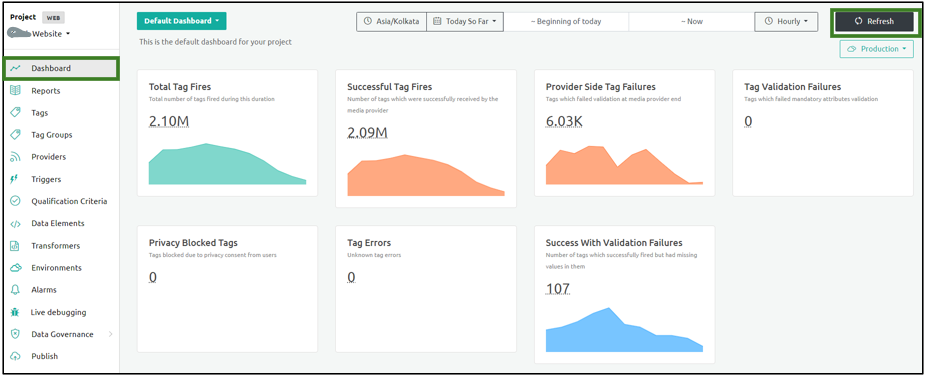
Dashboard Screen
The Dashboard screen includes the following details:
| Dashboard Screen | Description |
|---|---|
| Total Tag Fires | The total number of tags triggered during a particular duration. |
| Successful Tag Fires | The number of tags that the Media Provider successfully receives. |
| Provider Side Tag Failures | The tags that failed validation at the Media Provider. |
| Tag Validation Failures | The tags that failed mandatory attributes validation. |
| Privacy Blocked Tags | Tags that are blocked due to privacy consent from the users. |
| Tag Errors | Indicates the unknown tag errors. |
| Success with Validation Failures | The number of tags that are successfully triggered but have missing values. |
| Tag Distribution - Browsers | The number of successful tags across different browsers. |
| Tag Distribution - Devices | The number of tags across different devices. |
| Tag Contribution - Browsers | The browser composition of tags across the website. |
| Tag Contribution - Devices | The device composition of tags across the website. |
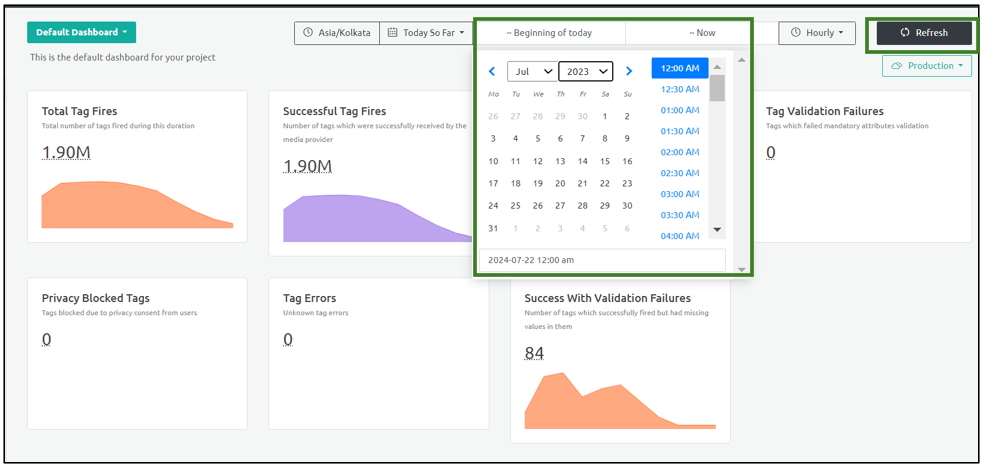
By default, the Dashboard is set to an hourly session and displays the Default Dashboard. To view the data for a different time duration, you must set the time range from the Last 24 Hours tab on the top of the page and click Refresh.
Ingest Labs retains the metadata information for 6 months at any given point. For customers who have Enterprise contracts with longer data retention needs, Ingest Labs retains and archives the data as agreed in contracts.
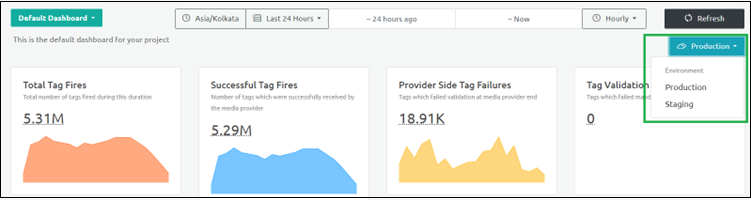
Note: You can switch the Dashboard display either to Staging or Production environment.
To view the Dashboard for a specific custom range, select the time range from the drop-down options and click Refresh.