Add Widgets in the Dashboard
Perform the following steps to create widgets in the Dashboard:
Follow the procedure provided in "Create a New Dashboard" to create a new dashboard.
Click Add Widgets.
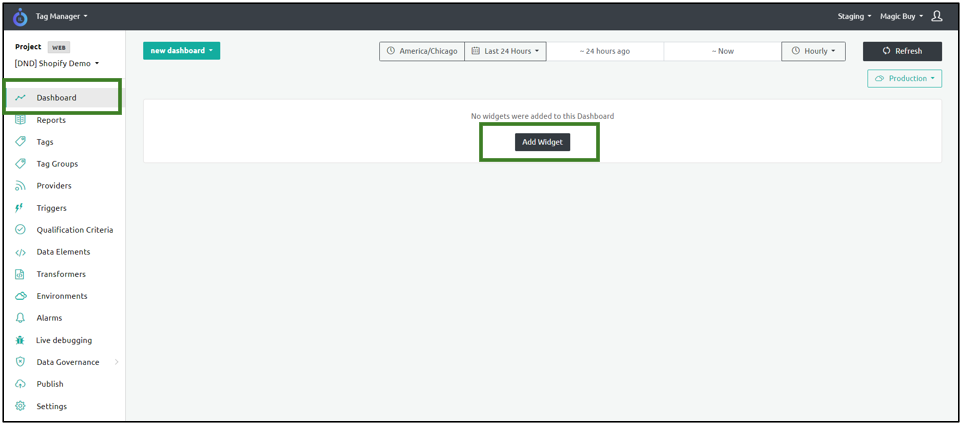
The widget screen displays three visualization types.
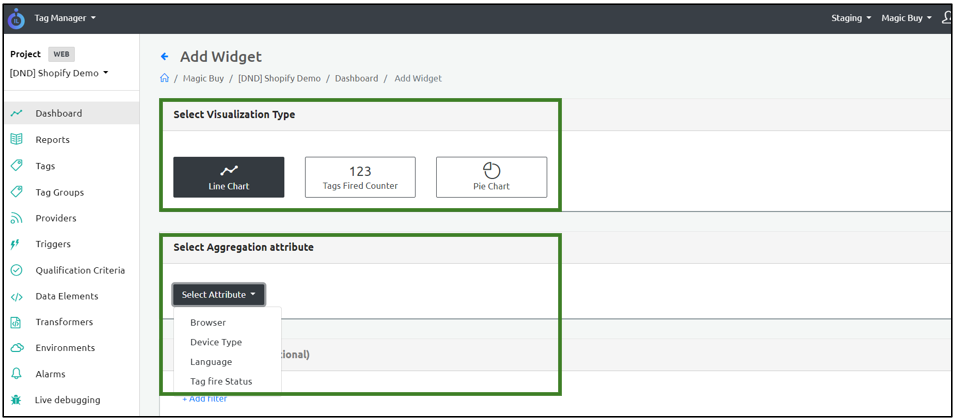
- Select one of the following Visualization Types and configure the settings on how the data appears:
- Line Chart
- Tags Fired Counter
- Pie Chart
- Select Line Chart and set the aggregation attributes to one of the following types:
| Aggregation Attribute | Description |
|---|---|
| Browser | Select this option to display information regarding the Browser types such as Chrome, Safari, Edge, IE, Firefox, Opera, and Other. |
| Device Type | Select this option to display the device type such as Desktop Web, Mobile Web, Tablet, and Other. |
| Language | Select this option to set the preferred language. The available languages are English, Spanish, and Other. |
| Tag Validation Failures | The tags which failed mandatory attributes validation. |
| Tag Fire Status | Select this option to set to one of the Tag trigger Statuses. • Success (200) • Success (202) • Provider Side Failure (400) • Provider Side Failure (404) • Provider Side Failure (500) • Tag Validation Failure (900) • Tag Validation Failure (1000) • Error (1001) • Privacy Blocked (1002) • Skipped (1003) • Success with Warnings (1004) • Scheduled for retry (1005) • Maximum retry attempts reached (1006) • Delayed (1007) |
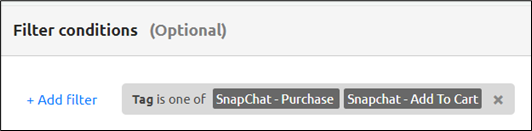
- Click Add Filter and select the various criteria to filter information.
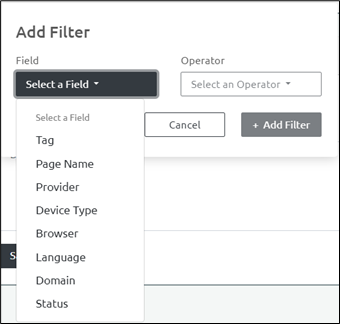
| Field Type | Description |
|---|---|
| Tag | Specifies the tag that needs to be filtered. |
| Page Name | Specifies the Page Name. Select either contains or is from the Operator drop-down menu. |
| Provider | Specifies the Provider that needs to be filtered. |
| Device Type | Select this option to display the device type such as Desktop Web, Mobile Web, Tablet, and Other. |
| Browser | Select this option to display information regarding the Browser types such as Chrome, Safari, Edge, IE, Firefox, Opera, and Other. |
| Language | Select this option to set the preferred language. |
| Domain | Select the appropriate domain name. Select either contains or is from the Operator drop-down menu. |
| Status | Select this option to set to one of the Tag trigger Statuses. • Success (200) • Success (202) • Provider Side Failure (400) • Provider Side Failure (404) • Provider Side Failure (500) • Tag Validation Failure (900) • Tag Validation Failure (1000) • Error (1001) • Privacy Blocked (1002) • Skipped (1003) • Success with Warnings (1004) • Scheduled for retry (1005) • Maximum retry attempts reached (1006) • Delayed (1007) |
- Select one of the following operators:
- Is one of
- Is not one of
- Click the arrow icon and select the filter for a specific field type.
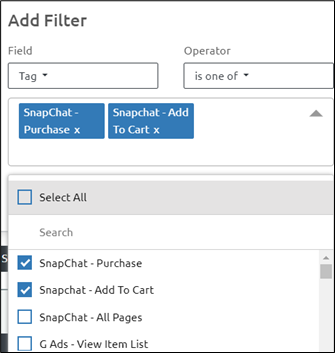
- Click Add Filter to add the filter conditions.
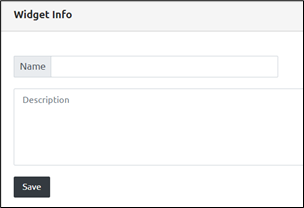
- Enter the Widget Name and Description under the Widget Info section and click Save.
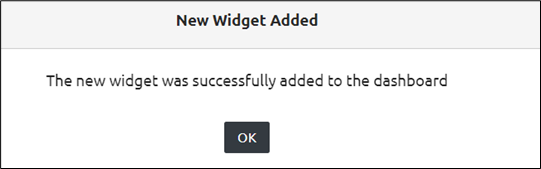
Step Result: The new widget is added successfully.
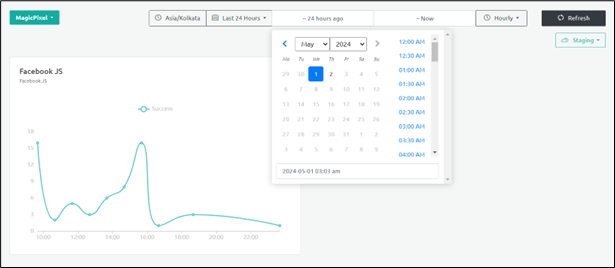
The Dashboard screen displays the required filtered information for a default period of 24 hours. You can also specify a time range to display the information for a specific period and click Refresh.
- You can perform the same steps as explained in this procedure for the Tags Fired Counter and Pie Chart.