Add Widgets in the Dashboard
Perform the following steps to create widgets in the Dashboard:
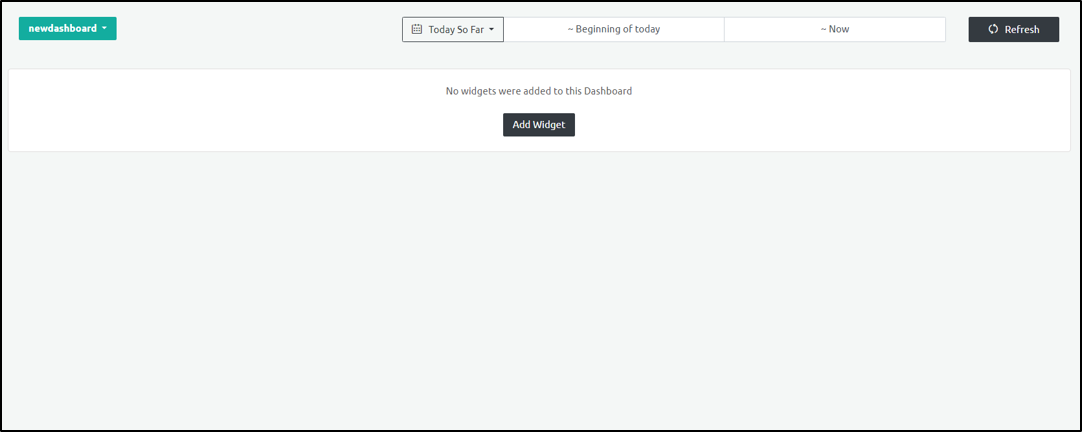
Follow the procedure provided in Create a New Dashboard to create a new dashboard.
Click Add Widgets.
- Add the name and the description of the widget.
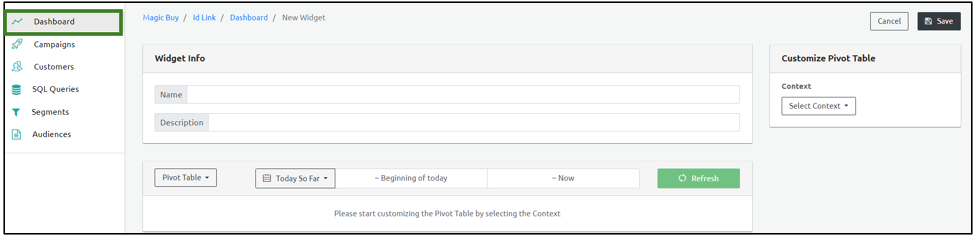
- Select one of the following visuals from the dropdown menu to configure the data format:
- Pivot Table - Displays the conversion data in a tabular format.
- Counter - Displays the total value of conversions.
- Stacked Area Chart - Displays the conversion data for a custom duration using a visual line chart.
Select the duration of the required data. You can select to view data from upto a month ago. You can also select a custom range.
Use the right vertical panel to customize the data. You can select the context, the dimensions and metrics and also customize the columns and the rows of the data table.
A. Context: Select one of the following contexts from the Context drop-down menu:
Context Description Conversion Events Select this for conversion data like conversion value, date, number, UTM source, medium, term, sales campaign, and browser. Orders Select this for conversion value, purchase item, and number of conversions. Conversion Comparison with CRM Data Select this for conversion date, count and value, data source, and sales channel. User Visits Stats Select this for visit date and type, App Type, and total users. B. Dimensions and Metrics: Select the Dimensions and the Metrics for each context. Select the checkboxes under Dimensions. Dimensions are independent data points received from the data collected. Metrics are generated from the data collected. For every context, you can select any combination of dimensions and metrics.
Context-based Dimensions and Metrics
i. Conversion Events: You can select the following dimensions for this context:
Dimensions Description Conversion Source Channel Select this option to display the conversion channel such as web or app. Browser Select this option to display information regarding the Browser type such as Chrome, Safari, Edge, IE, Firefox, Opera, and Other. Operating System Select this option to display information regarding the Operating System. Device Form Factor Select this option to display the information regarding the device type such as Desktop, Mobile, or Tablet. Language Select this option to set the preferred language. The available languages are English, Spanish, and Other. UTM Source Select this option to display the UTM Source such as adyogi, wishlink, and others. UTM Medium Select this option to display the UTM Medium such as Instagram, wishlink, and others. Campaign ID Select this option to display the Campaign ID. Campaign Referrer Domain Select this option to display the Campaign Referrer Domains like Instagram, Wishlink, Facebook, Google, and others. User Visit Type Select this option to display the user visit types such as returning logged-in users, returning anonymous users, first-time logged-in users, and first-time anonymous users. Creative Name Select this option to display the creative name of your website. You can select the following metrics for this context:
Metrics Description Total Conversion Value Select this option to display the total conversion value Average Conversion Value Select this option to display the average value of all the conversions. No. Of Conversions Select this option to display the total number of conversions. No. Of Conversions - Last Touch Select this option to display the total value of all the conversions. Total Users Select this option to display the total number of users Average Sales Time Select this option to display the average time taken for a sale. ii. Orders: You can select the following dimensions for this context:
Dimensions Description Conversion Date Select this option to display the exact date of the conversion. Purchase Item Select this option to display the code number of the purchased item. You can select the following metrics for this context:
Metrics Description Total Conversion Value Select this option to display the Total Conversion Value. Number of conversions Select this option to display the total number of converted users. iii. Conversion Comparison with CRM: You can select the following dimensions for this context:
Dimensions Description Conversion Date Select this option to display the Total Conversion Value. Data Source Select this option to display the data source of the conversion such as the CRM or Ingest Labs. Sales Channel Channel used for the sales such as app or web. You can select from the following metrics for this context:
Metrics Description Total Conversion Value Select this option to display the Total Conversion Value. Total Conversion Count Select this option to display the total number of converted users. iv. User-Visit Stats: You can select the following dimensions for this context:
Dimensions Description Visit Date Select this option to display the date of the user's visit. User Visit Type Select this option to display the first and the returning visits of registered and anonymous users. App Type Select this option to display if the user uses the app or web for the website visit. You can select the following metrics for this context:
Metrics Description Total Users Select this option to display the total number of users in the selected dimensions.
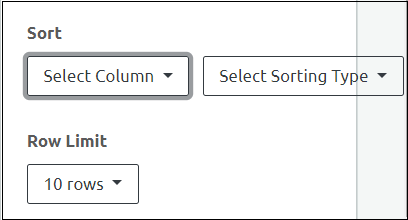
Sort: In the Sort section, use the dropdown menus to select the column to be sorted using the ascending or descending order. Select the number of displayed rows from the Row Limit Dropdown menu.
- Enter the Widget Name and Description under the Widget Info section and click Save.
Step Result: The new widget is added successfully.
As per the current filter conditions applied, the information displayed on the Dashboard screen is for a default period. You can specify a time range to display the information and click Refresh.
Perform the above steps for the Counter and Stacked Area Chart.